
Knowledge Base > Analytics > Devices and browsers statistics
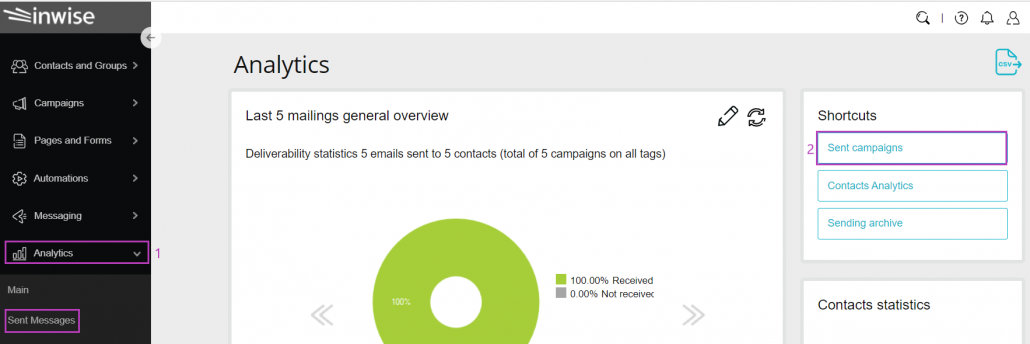
On the main login screen, click on the “Analytics” tab in the main menu bar on the left (1).
On the “Common Actions” pane, click on the ”sent campaigns” button (2).
You can also select “sent campaigns” directly from the main menu bar.
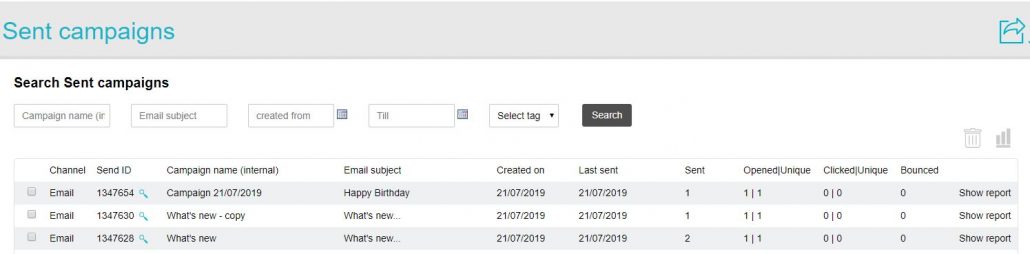
Click on the campaign you want to review. This will take you to the campaign analytics data screen, where you can see the performance funnel, campaign details, and other campaign statistics. More information is available in this guide.
In the “User Agents” pane at the bottom left of the screen, you can see the distribution of viewing percentages between mobile devices and desktops.
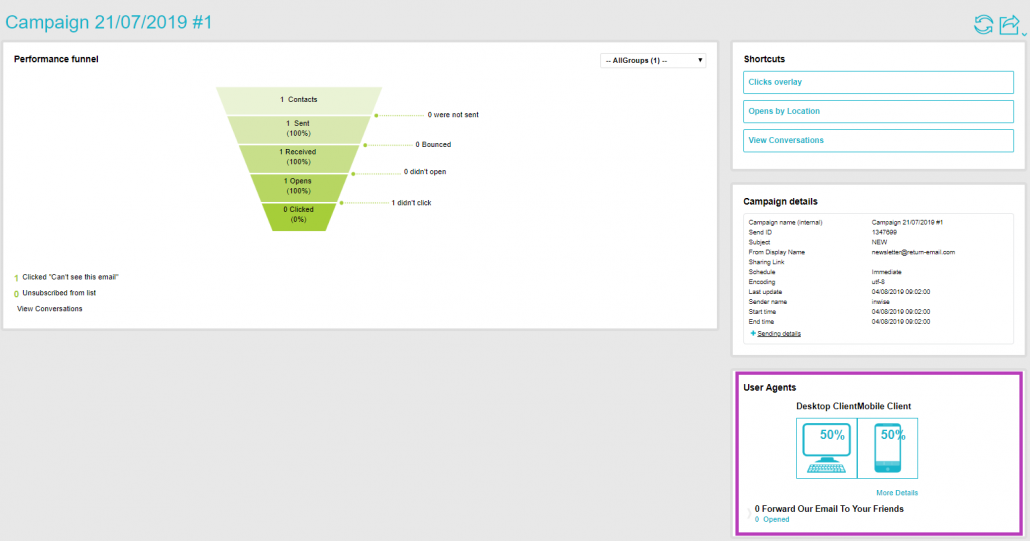
Click on “More details” located below the graphic. This screen lists the browser data and operating systems from which the campaign was viewed.
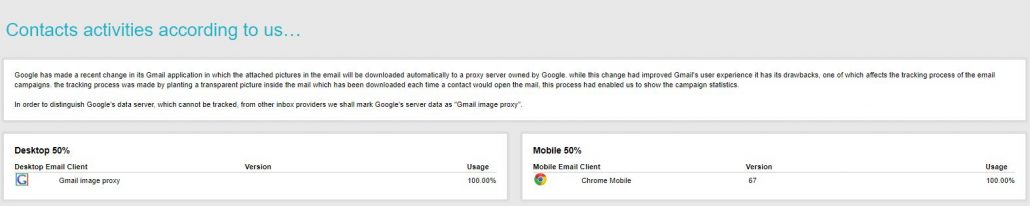
Utilizing this data, you can strengthen the relationship with your contacts using the platform of their highest viewing percentage. For example, if the viewing percentage on mobile devices is higher, you can continue communicating with your contacts by sending SMS messages that target one of the products or services that appeared in the email campaign you sent.