
Knowledge Base > Analytics > Analytics – Analysis of campaign results
The Analytics page opens in the inwise analytics area. You can view a summary of all campaign statistics sent by email and SMS. Learn about the percentage of times each campaign was opened, how many clicks were made in each campaign, the distribution of clicks between the links, information about the contacts who performed actions in the campaign and much more.
This guide contains 4 parts:
- Viewing sent campaign data
- Campaign details
- Performance Funnel
- Clicking map
1. Viewing sent campaign data
On the main login screen, click on the “Analytics” tab in the main menu bar on the left (1). On the “Common Actions” pane, click on the ”sent campaigns” button (2).
You can also select “sent campaigns” directly from the main menu bar.
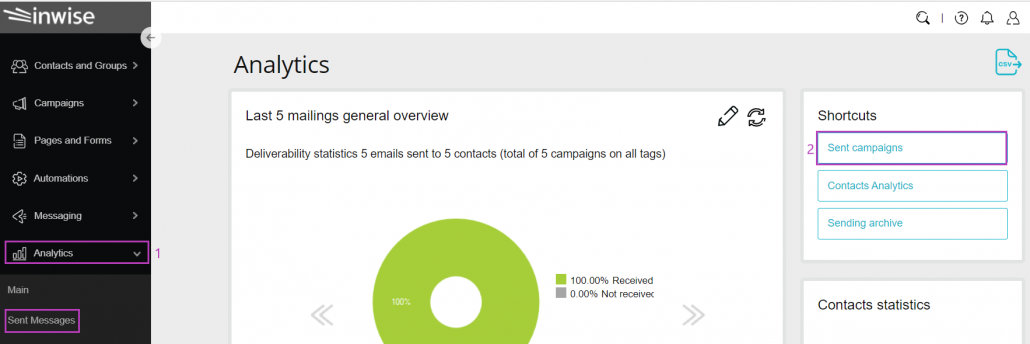
In order to see all sent campaign data, click on “Sent campaigns” under the shortcuts.
You’ll transfer to the “sent campaigns” pages:
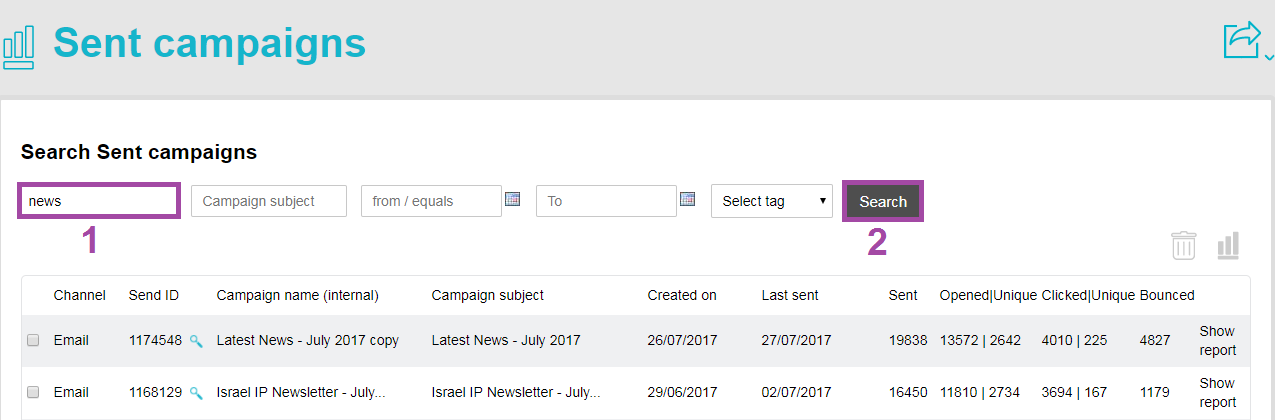
On this page, you can see all the sent campaign statistics. Also, you can search for a specific campaign by typing the campaign details.
The column headings are explained below:
- Channel – campaign type (Email/SMS)
- Send ID – unique number automatically generated for each mail.
- Campaign name – Your identifier for the campaign.
- Campaign subject – An additional identification or description of your choice for the campaign.
- Created on – date the campaign was created (only sent campaigns are listed here).
- Last sent – displays only the last date the campaign was sent.
- Sent – number of contacts to which the campaign was sent.
- Opened – number of times the campaign was opened. Contacts can open the campaign repeatedly but each opening is counted.
- Opened Unique – number of contacts that opened the campaign. Each contact is counted only once even if they have numerous openings.
- Clicked – counts each click on any campaign link.
- Clicked unique – counts each click once even though they clicked repeated links.
- Bounced – email that hasn’t reached its destination and is returned by the contact’s email server.
2 types of Bounced emails:
- Hard Bounced – email address doesn’t exist or typed wrong. (e.g. For a contact who left his job and got a new email address, the old one isn’t relevant anymore).
- Soft Bounced – usually a temporary problem in emails, such as full box or server issues.
2. Campaign details
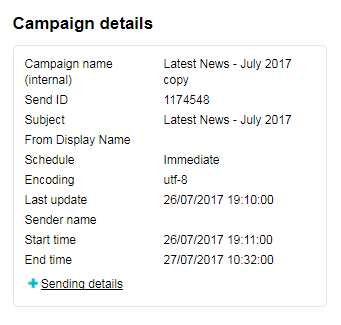
This page shows all campaign sending details:
The name of the campaign, send ID, Campaign subject and the mail address that the mail will send from.
Click on Sending details to show the Start & End times that the campaign was sent to each group.
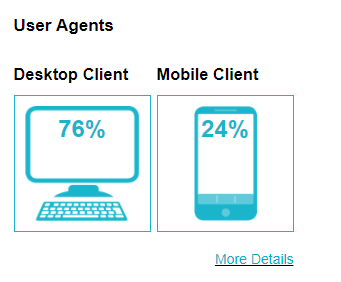
Under it, you’ll find the “User Agents” pane, which contains the proportion by the percentage of each operating system that opened the campaign.
3. Performance Funnel
The performance funnel lets you view and analyze the campaign’s performance and track the sending details – total contacts sent the campaign, total contacts in receipt, total clicks and openings.
For your convenience, you can find explanations about the data obtained from the top-down performance funnel below:
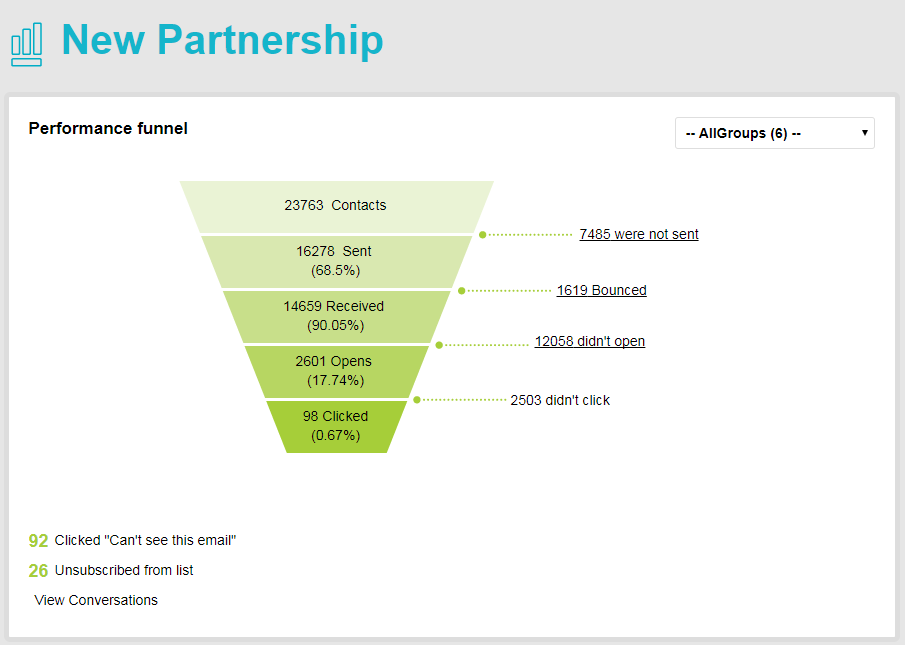
- Contacts – the sum of contacts from all groups to which the campaign was sent.
- Sent – number and average of contacts to which the campaign was actually sent.
- Were not sent/Blocked – explains any discrepancy in contact delivery. This area shows the number of contacts who didn’t get the campaign although they may be in the group to which the campaign was sent. Some reasons for non-delivery:
1. A contact was asked to unsubscribe from the contact list.
2. The email address was defined as bounced according to the bouncing policy.
3. An invalid address due to syntax. - Received – number and percentage of contacts who received the campaign.
- Bounced – number of bounced emails.
- Opened – number and percentage of contacts that viewed the campaign or clicked on “Show images”.
- Didn’t open – number of contacts that didn’t open or view the campaign.
- Clicked – number and average of contacts who clicked on at least one link in the campaign or clicked on “view in Explorer”.
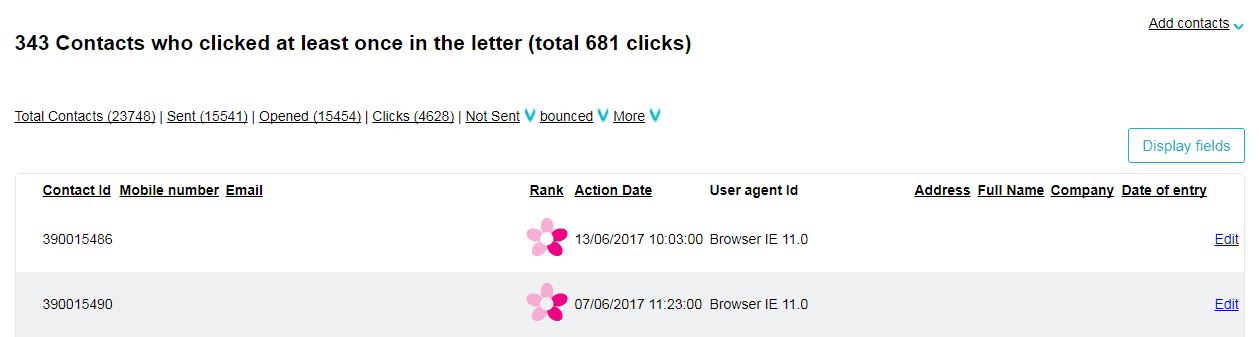
- Didn’t click – number of contacts that didn’t click on any links in the campaign. Clicking on any of the funnel sections will open the relevant contact’s detail (e.g. clicking on Opens will show the following page).
Here you can see all contacts and their details. Their rank in the system can be viewed by clicking the flower.
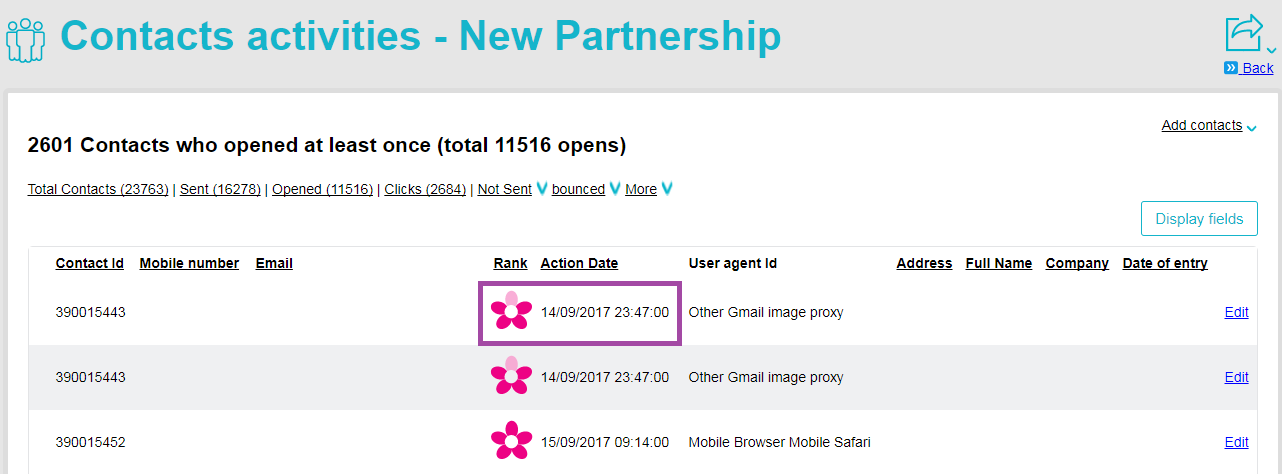
You can export the list to a CSV file, by clicking on the export button on the top right![]() .
.
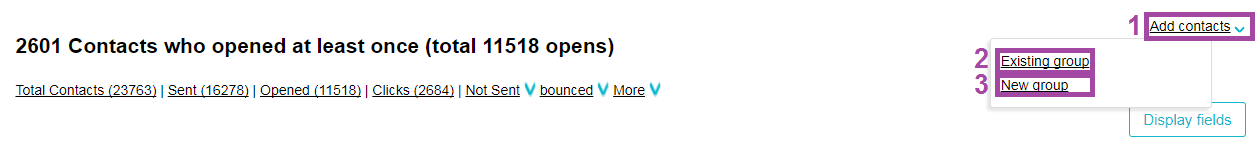
In addition, you can add this list to a new or existing group in order to send them unique campaigns tailored specially for that group. You can do it by clicking on Add contacts (on the top right), and select either Existing groups or New groups.
4. Clicking map
On the main Analytics page, you can see the Clicking map.
Here you can see the click percentage of each campaign link, and know who the contacts that clicked on each link are.
To access the clicking map scroll down, or click on “Clicking map” on the right side of the page under “Shortcuts”.
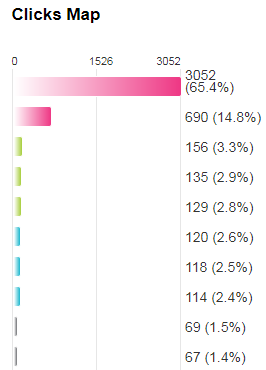
On the left, you can see the campaign preview, and in areas where there are links a color bar will appear.
When you hover over it you’ll see the link address. With the pointer over each link the click percentage and number of clicks will appear.

To the right of the campaign is a list of the links, as well as the number and percentage of clicks. Clicking on any of these will lead you to a list of contacts that clicked on each link.
Below the click map, you can see data by geographic location and the countries in which the campaign was opened or clicked.